Zomato Bangalore Restaurants Analysis & ML
An Exploratory Data Analysis (EDA) and predictive modeling pipeline examining over 50,000 restaurant listings in Bengaluru to forecast ratings, online ordering trends, and pricing patterns.
Dataset Size
50,000+ Records (17 Cols)
Online Orders
59% Yes / 41% No
Environment
Jupyter Notebook / Python
Top Location / Type
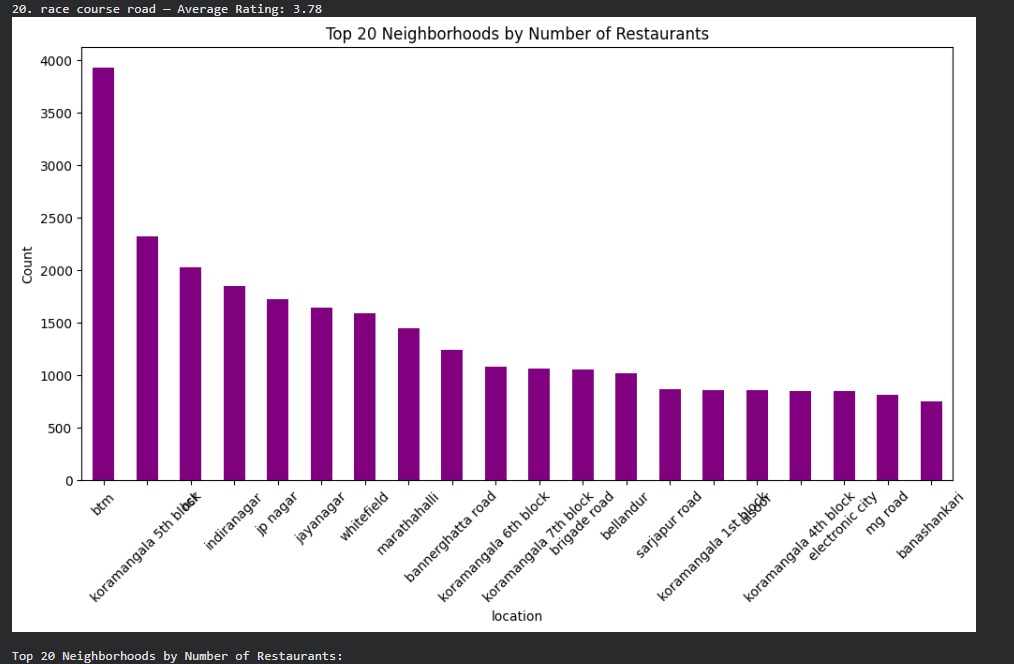
BTM (10%) & Quick Bites
Project Overview & Objective
This project processes the comprehensive Zomato Bengaluru restaurant dataset. By cleaning raw features, filtering 17 structural columns, and running detailed EDA, the notebook uncovers the primary drivers behind restaurant ratings, table booking availability, and cost distributions across key districts like BTM and HSR.
Tools & Data Science Stack
Notebook Pipeline Stages
1. Data Preprocessing & Cleaning
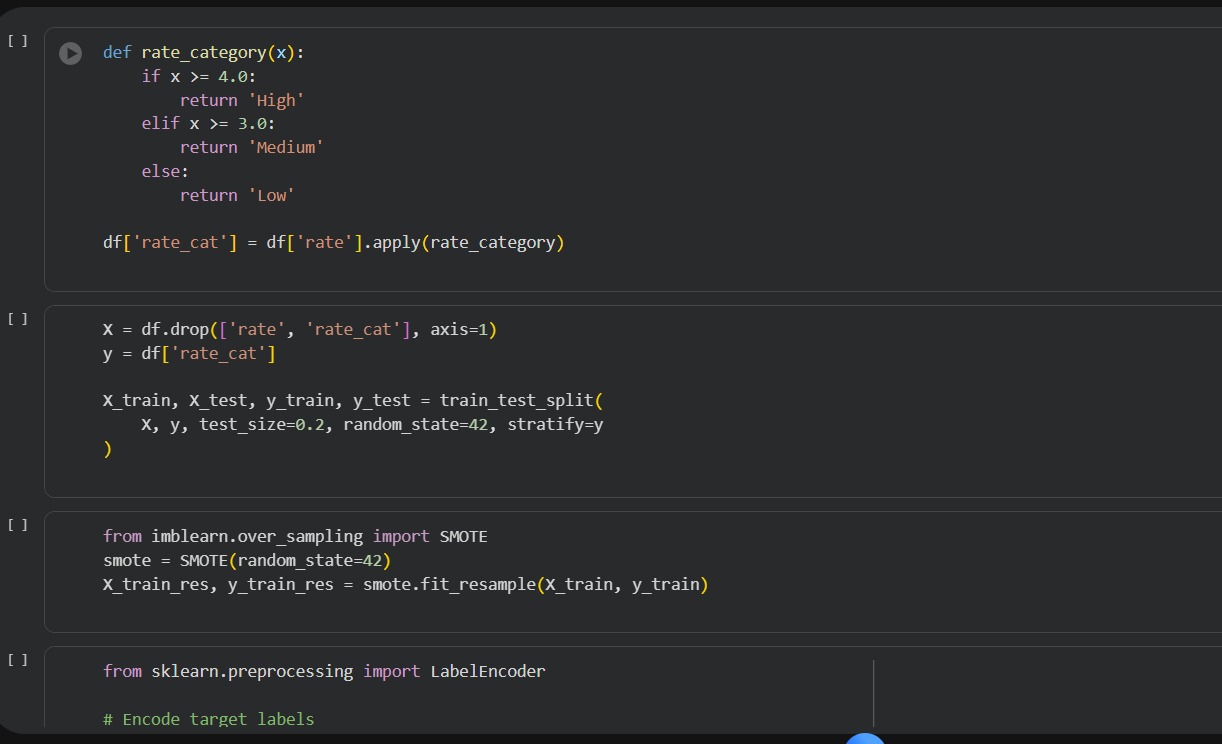
Dropping irrelevant columns (url, phone, address), handling missing values in ratings and restaurant types, and removing duplicates.
2. Exploratory Data Analysis (EDA)
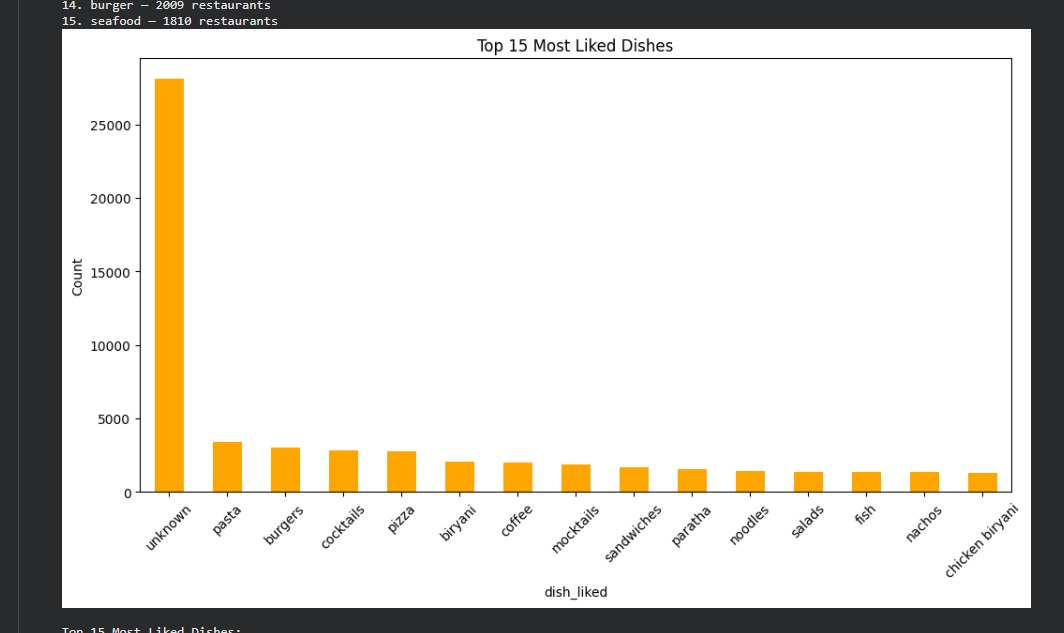
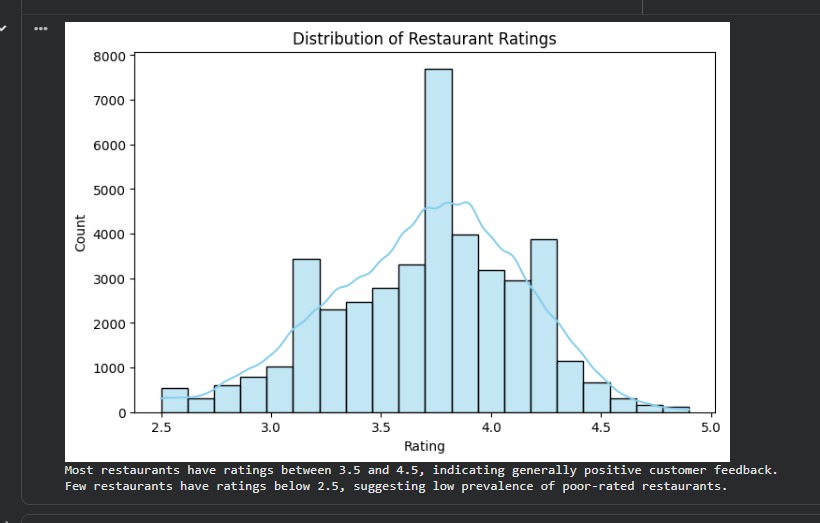
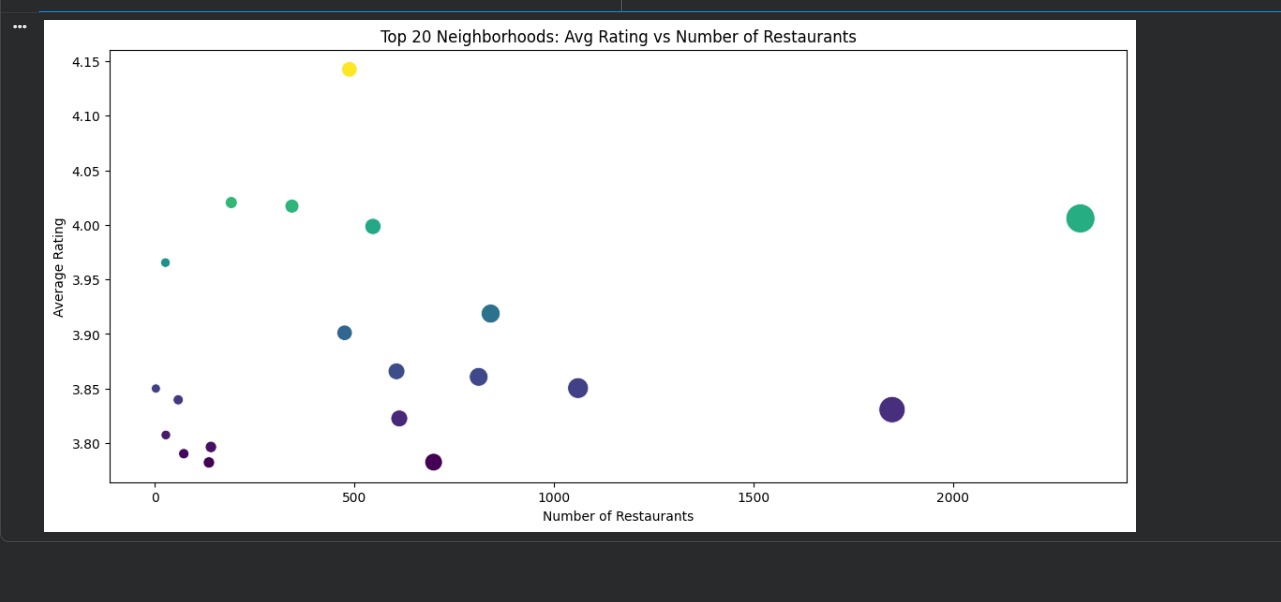
Visualizing online order distribution (59% vs 41%), table booking ratios (12%), and high-density restaurant locations like BTM.
3. Predictive Modeling & Evaluation
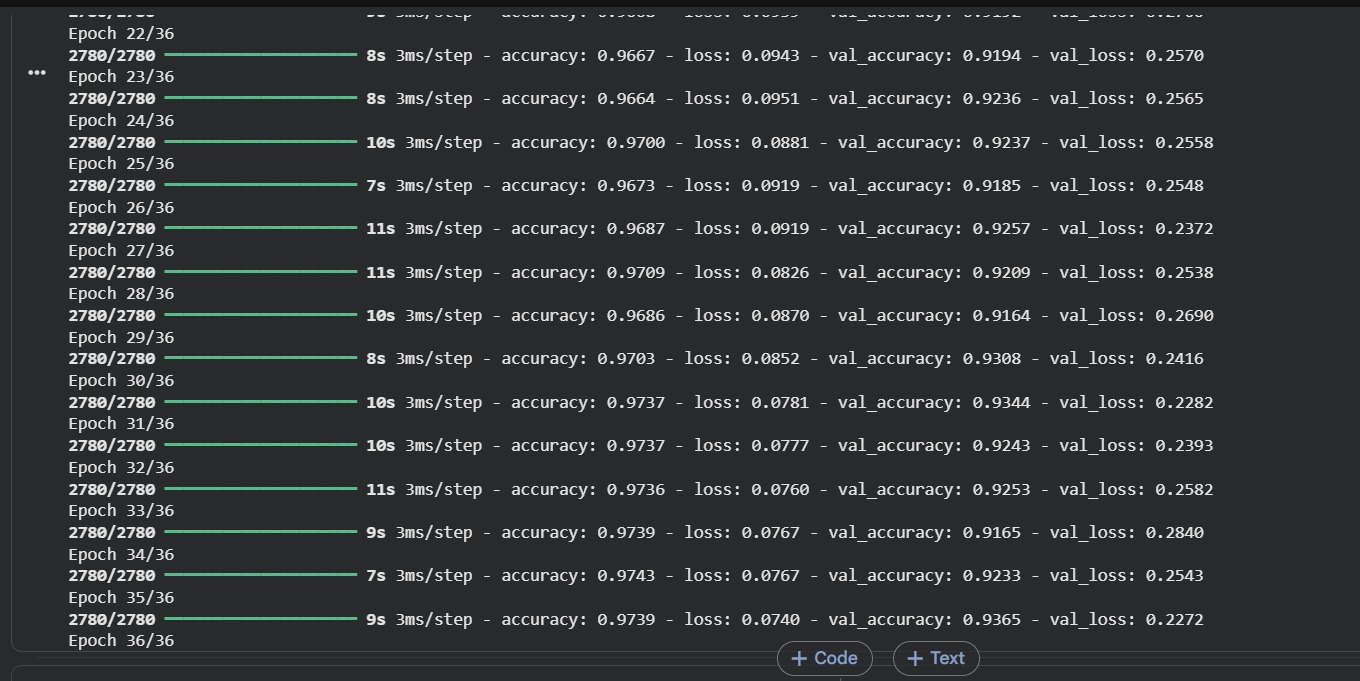
Applying regression algorithms to forecast restaurant ratings and pricing based on votes, cuisines, and location metrics.
Notebook Plots & Visualizations